Lesson 01 · the free taster

Hello, Viz: a working extension in the next ten minutes

Sheet 1 of 10
Sheet 1

What you are looking at is live.

This KPI card is a real Tableau viz extension, running right now in your browser. Not a screenshot, not a video. The actual shipping code, on sample data. Go on, hover it.

kit/kpi-card · live, in your browser

Before the last sheet, a card like this will be running inside your own Tableau, loaded by you, drawing from a real worksheet. No code, no installs beyond Tableau itself. That is the whole promise, and this lesson keeps it today, not at the end of the course.

One bit of house style before we go: a lesson here is a workbook, every step is a sheet, and the tab strip at the bottom is yours. Flip at your pace.

Sheet 2

Why this course exists right now.

A longtime Tableau leader, someone I respect, recently asked me a hard question in private: with AI writing charts on demand, why does anyone need Tableau at all?

Here is the honest answer I landed on. AI really did make charts cheap. The internet calls it vibe coding, and in serious BI circles that name is close to an insult. Fair enough: a pile of AI-generated web files with no review, no permissions, no refresh schedule, and no audience deserves the sneer.

But notice what the sneer is about. It is not the speed. It is the missing governance, security, and distribution, and Tableau already has all three. That is not the boring part of the stack. That is the part your company pays for. Viz extensions are the bridge: the visual is AI-built and fast, while the data, the permissions, and the audience never leave Tableau.

What that looks like in practice, from my own last two months:

  • A dashboard stuck in development for seven months, rebuilt from scratch with extensions in one week.
  • A client in tears at handoff. Not because the dashboard was beautiful, though she said that too. She could not believe her data held that analysis. Two weeks of work, every visual an extension, every line AI-built.

The hours I used to spend dragging pills and fighting layout containers now go into the analysis itself. So this course does not teach vibe anything. It teaches directed building: you describe, Claude builds, you make it prove itself, and Tableau keeps the guardrails. You stop spending your time building, and you start spending it thinking.

Sheet 3

The rehearsal: sixty seconds, nothing installs.

On Sheet 6 you do this for real in your own Tableau. The real thing takes five moves:

  1. Open a workbook and a worksheet.
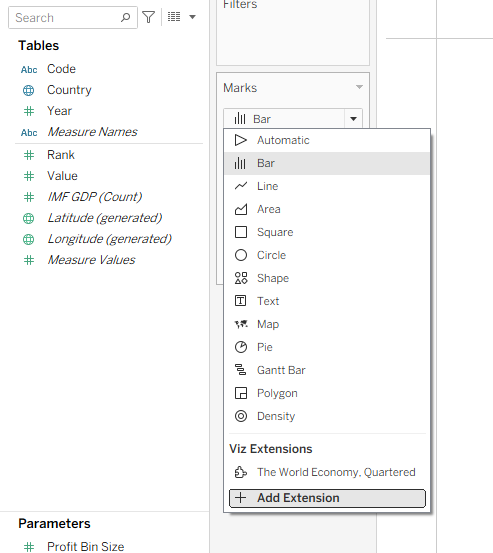
  2. On the Marks card, open the mark-type menu and choose Add Viz Extension.
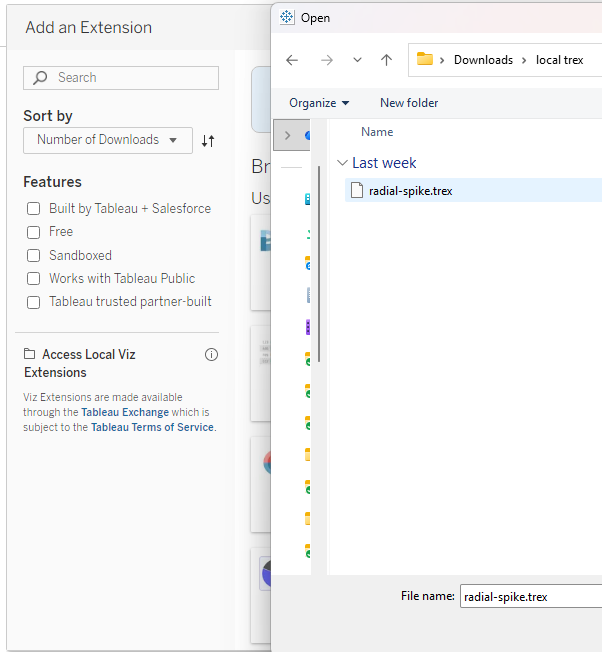
  3. Point it at a .trex file (Access Local Viz Extensions).
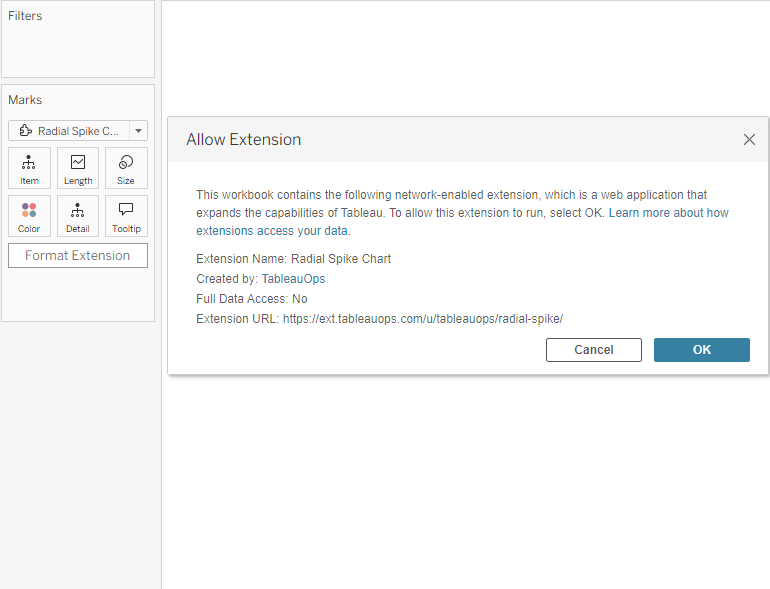
  4. Tableau shows what the extension can see. Click Allow.
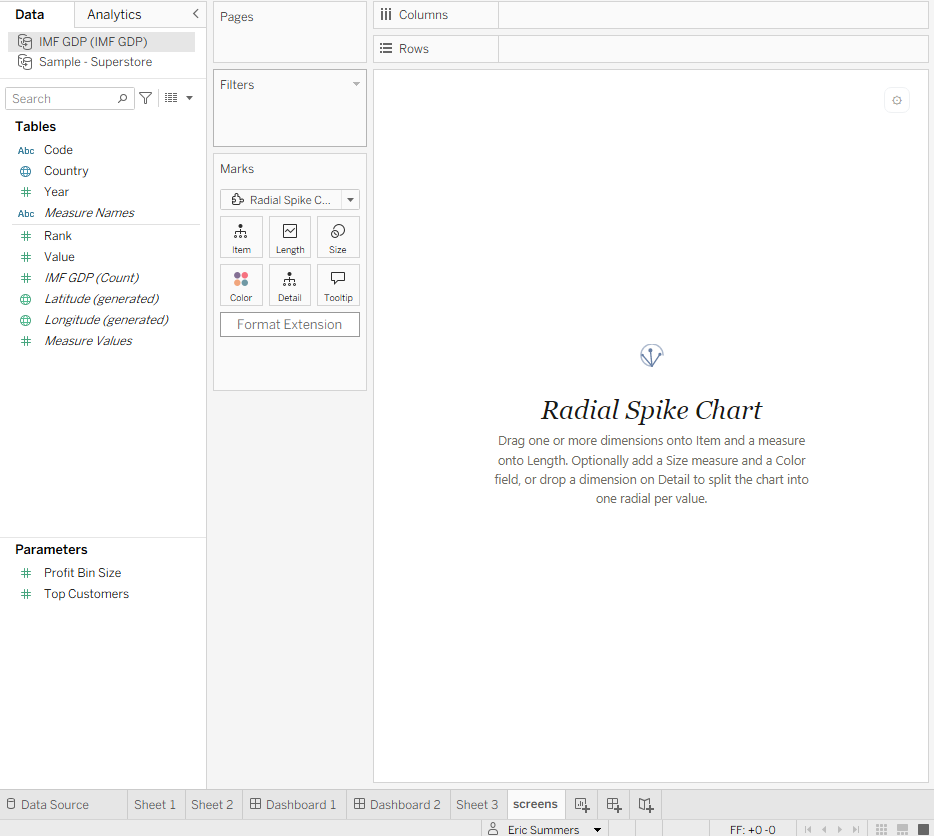
  5. Drop fields on its new encoding tiles. It draws.

Rehearse the shape of it right here first: grab the .trex, load it, click Allow, then style what appears. All you need today is a browser; Tableau enters on Sheet 6.

Try it right herea mock, nothing installs
Load your first extension: a real KPI card.

A sixty-second mock: nothing installs, nothing leaves this page. Follow three steps: load a real KPI card, style it your way, and get the .trex that runs it in Tableau.

Sheet 4

The style room: that was five swatches. Here is the whole wardrobe.

The mock gave you five accents and a theme toggle. The real KPI Card has a full wardrobe, and there is a room on this site where you drive every control it ships with, live, no account, no install.

Your mission in there, two minutes, tops:

  1. Click a one-click preset. Then break it on purpose: swap the chart type, stack a comparison, flip the theme.
  2. Drag a card’s corner to resize it. Watch it reflow instead of clip.
  3. Add the second card (the + button) and put Profit next to Sales. One style, two metrics.
  4. Hit “Email me my mockup and the prompt” and send yourself what you made.

Now the part worth pausing on. You just made about twenty design decisions on a real, shipping extension and wrote zero code. And the email in your inbox contains something better than a picture: one plain-English sentence describing exactly what you built. That sentence is a build prompt. In Lesson 3 you learn to write them from scratch, and from then on sentences like it are how you build everything. Keep that email; Sheet 9 gives it a shelf.

Sheet 5

The one idea: a .trex is a pointer.

An extension is just web files: an index.html, some JavaScript, a little CSS. The .trex is a one-line note that says "the files are over there." Tableau reads the note, fetches the files from wherever it points, and draws them as a viz, in place of a built-in mark type.

The files can live in exactly two places: on a host like ext.tableauops.com, which is where the one you are about to load lives, or on your own laptop while you build, which is how Lesson 2 starts. Same extension, different address. The .trex just holds the address.

What is the single file Tableau actually reads to load an extension?
A .trex file. It is a tiny text pointer, not the extension itself. You now know what it points at, which means the rest is downhill.
Sheet 6

Now for real: load one into your own Tableau.

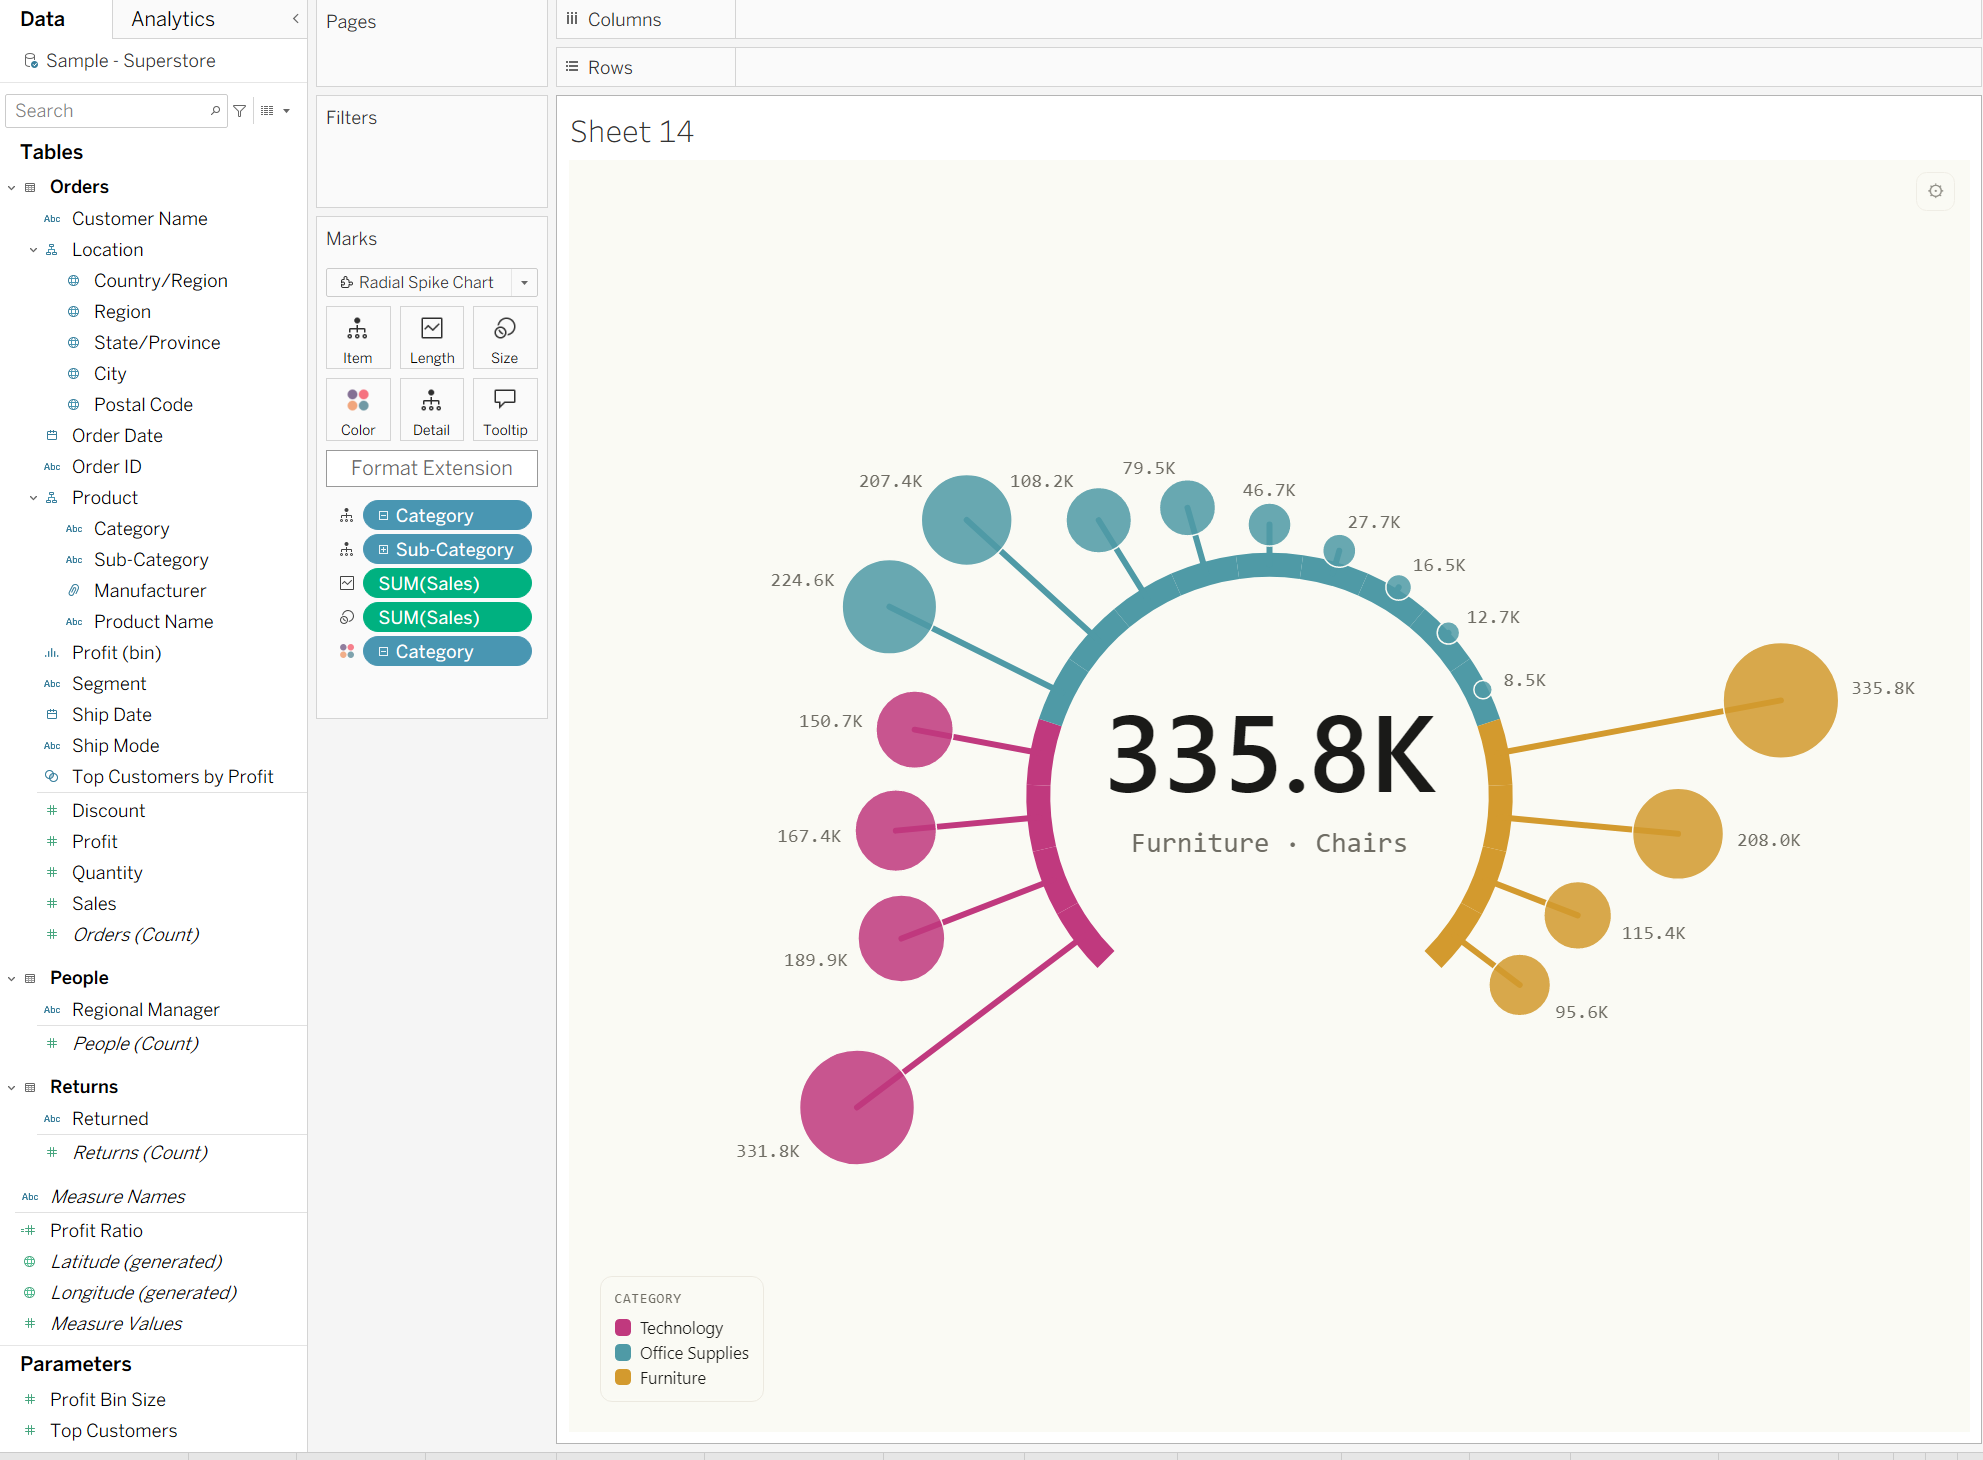
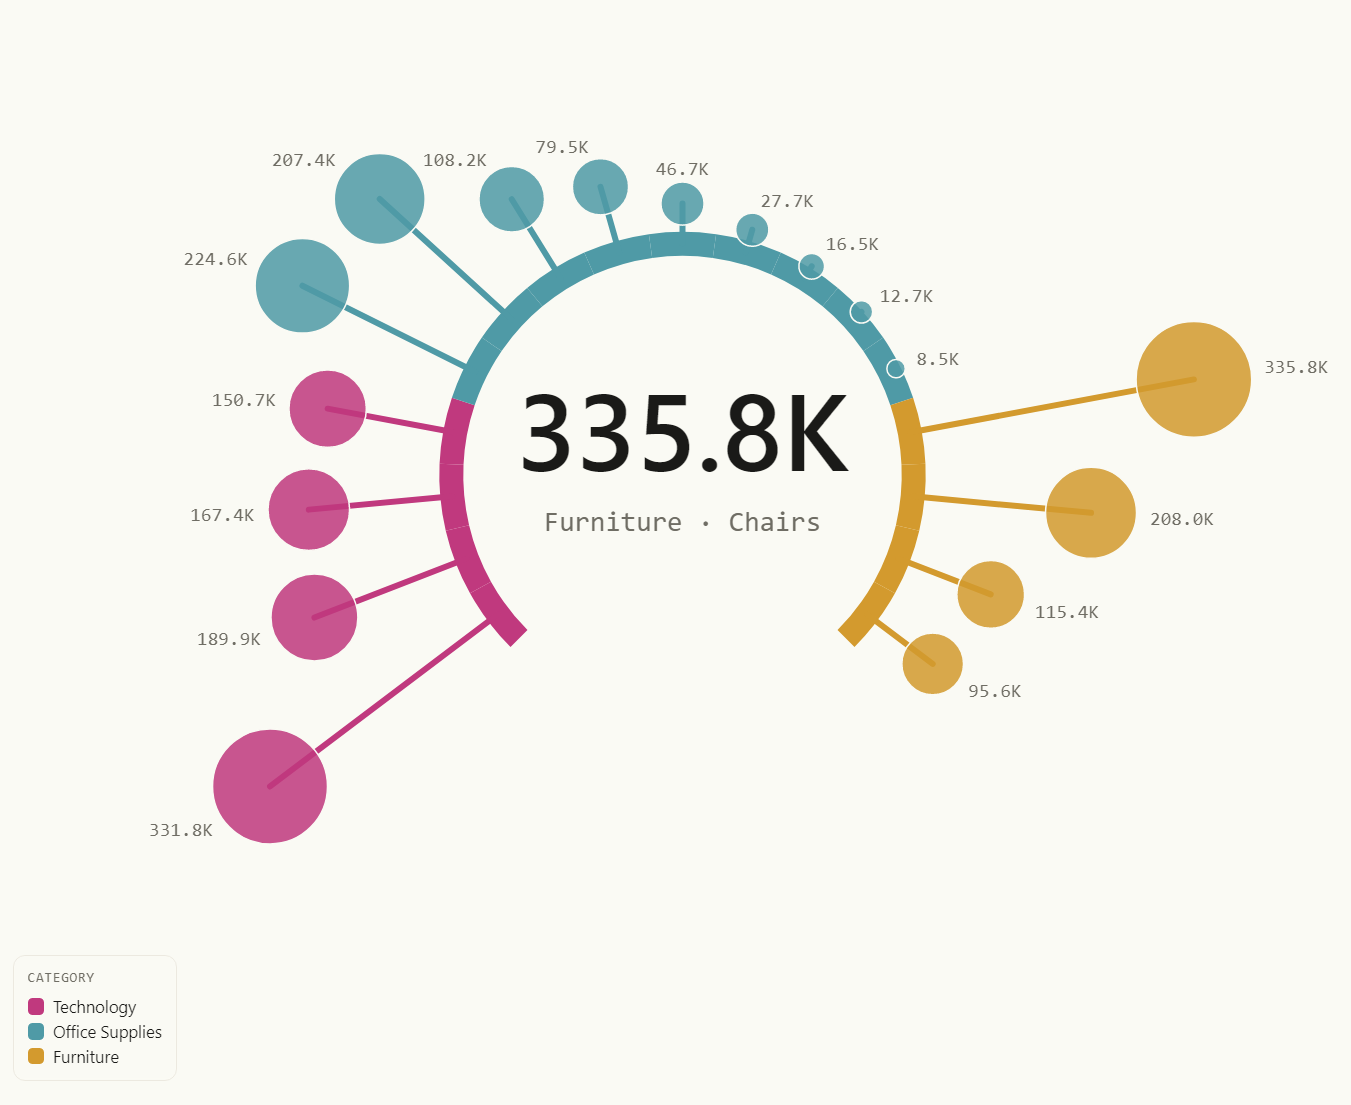
No mock this time. This button downloads a real .trex, a pointer at radial-spike: the same viz extension Tableau lists on its Exchange, hosted on this site. You spent the lesson styling the sensible card. For your first real load you get the showstopper.

It saves as radial-spike.trex. Then, in Tableau, the same five moves you rehearsed:

  1. Open any workbook with data. The Superstore sample that ships with Tableau is perfect.
  2. Open a worksheet. On the Marks card, open the mark-type menu and choose Add Viz Extension.
  3. Choose Access Local Viz Extensions and pick radial-spike.trex.
  4. Tableau shows you exactly what the extension can see. Click Allow.
  5. New tiles appear on the Marks card. Drop a dimension like Sub-Category on Item and a measure like Sales on Length.

It draws. One spike per item, arranged around an arc, a chart Tableau has no native mark for, now running as a mark type in your worksheet behind Tableau's own permission gate. Drop another measure on Size, swap the field on Item, watch it follow. You did the whole thing, and it took about two minutes.

  • If "Add Viz Extension" is not in the mark-type menu: viz extensions arrived in Tableau 2024.2; an older Desktop does not have the door. A free trial of current Desktop counts. Tableau Public will not load outside extensions directly; there is a move for that, the snapshot, and it gets your work into a Public workbook anyone can open. That comes later in the course. For today, use Desktop or the free trial.
  • If it is blank after Allow: nothing draws until fields land on its tiles. Item plus Length is the minimum pair.
  • If you went looking under Dashboard › Objects › Extension: that door is for dashboard extensions. This one is a viz extension: it loads from the Marks card, on a worksheet, and that is the door this whole course builds for.
  • About that Allow dialog: it lists what the extension can access, and nothing loads until you approve. That gate is Tableau's governance working for you, and it is half the reason this whole approach is safe to use at work.
Sheet 7

What just happened, in one breath.

You now know the entire shape of the thing:

  • An extension is web files.
  • A .trex is a pointer at those files.
  • Today the files sat on our host, which is why your radial worked with zero setup.
  • While you build your own, they sit on your laptop instead. That is Lesson 2, and a well-built extension wears a little badge that flips from HOSTED to LOCAL to show you which world you are in.
  • Either way, Tableau reads the pointer, asks permission, and draws.

Everything else in this course is detail on top of those five lines. Which raises the obvious question: who writes the web files?

Sheet 8

You don't. You direct. Here is the preview.

Starting in Lesson 2 you install Claude and the TableauOps skill, and from then on you describe, Claude builds, Tableau draws. You will hand Claude copy-paste blocks like these. This is what directing looks like:

Build make the thing
Make the KPI number 40% larger and give the delta arrow
more contrast against the card background.
Verify make Claude prove it worked
Open the browser console, confirm there are zero errors,
and paste the output here before we continue.

The build layer is the intern's job now. The thinking layer, deciding what to build and proving it works, stays yours, and it is the layer that was always worth the money. Describing is a skill. Verifying is the skill that gets you the raise. You will practice both, in every lesson.

Sheet 9

Park the win. Both of them.

Every lesson leaves you real artifacts on a shelf you can come back to. Lesson 1 leaves two.

Park it: the .trex address you loaded
The pointer behind the card now sitting in your Tableau. Saved in this browser, per lesson.
Park it: your first build sentence
Paste the sentence from your style-room email. It is your first build prompt, and Lesson 3 teaches you to write them from scratch.

One sentence for yourself: which surprised you more, the extension landing in your Tableau, or how little of it was code? Hold that thought into Lesson 2.

Sheet 10 · the last one
You just ran the whole lap.

A real extension is running in your Tableau right now, and you know every piece of how it got there. That is Lesson 1. Eight more take you from "I loaded it" to "I built and shipped my own," each one starting from a finished extension you own.

Lesson 1 is free. Lessons 2 through 9 come with the course, $49, yours forever ($119 as the Complete Kit, with all seventeen production extensions). 30-day guarantee.

TableauOps · a lesson is a workbook, a step is a sheet · ext.tableauops.com