Tableau Data Apps
A data app is a web app that runs inside Tableau on one worksheet and draws whatever it likes from that worksheet's rows: particles, games, music, ops tools. These are the ones I've built so far, newest first.
Each link opens a public copy that runs in your browser on a bundled copy of its data. Why build a data app instead of an extension? Race to Publish shows the difference.
 7,235 hot air balloons from a spotter's database in an 8-bit sky. Explore by home, owner, maker, type or era, watch a mass ascension, keep a logbook.
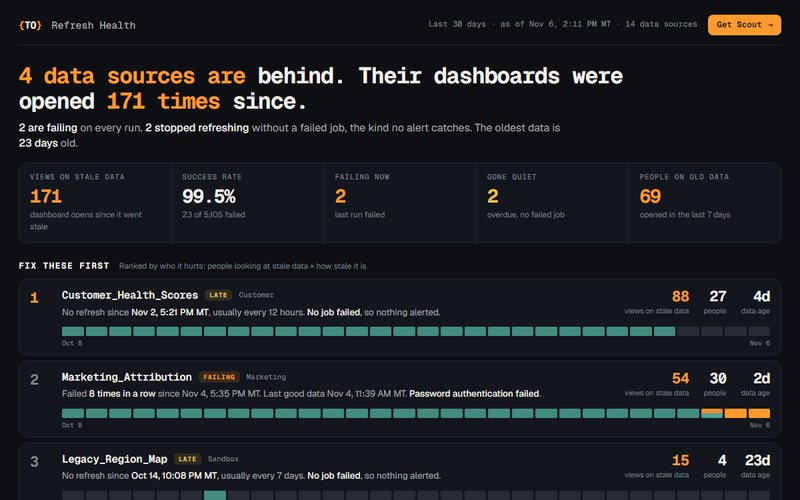 Every Tableau data source ranked by who a failing or quiet refresh hurts.
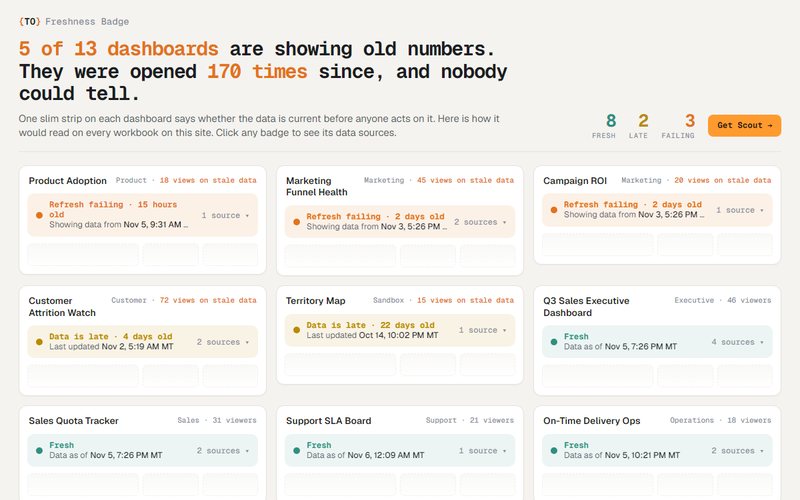 One slim strip for any Tableau dashboard: fresh, late or failing, before anyone acts on old numbers.
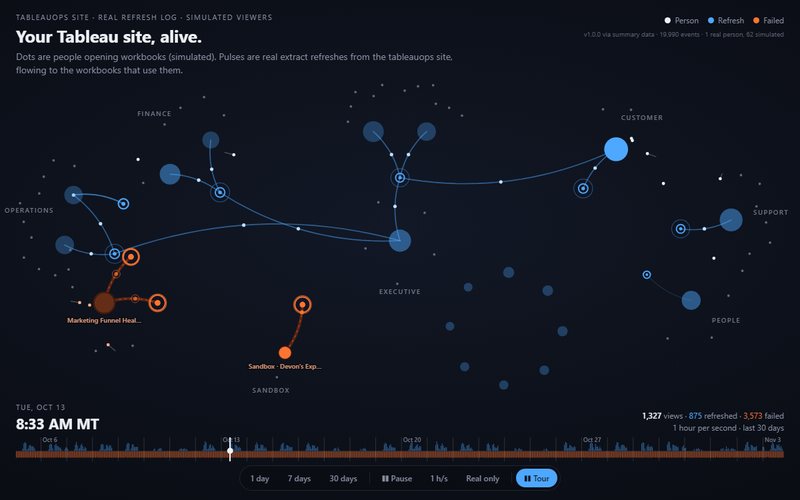 A Tableau site activity log replayed as a living map: people, workbooks, extract refreshes and the failures that reach them.
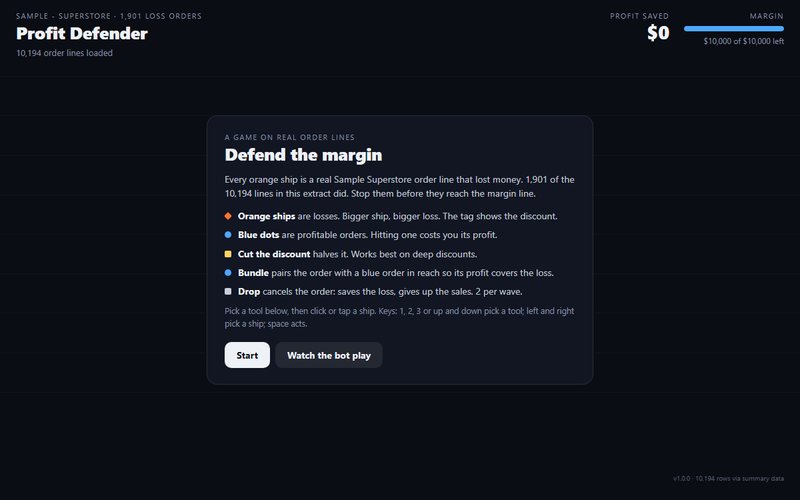 An arcade game played on real Sample Superstore order lines: stop the loss-making orders before they reach the margin line.
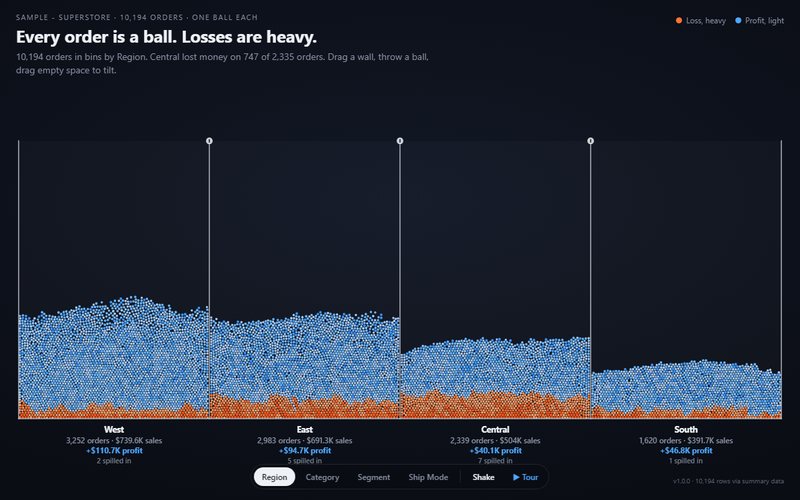 10,194 Sample Superstore orders as balls in a physics sandbox. Losses are heavy and sink. Drag the walls, throw the balls, tilt and shake the box.
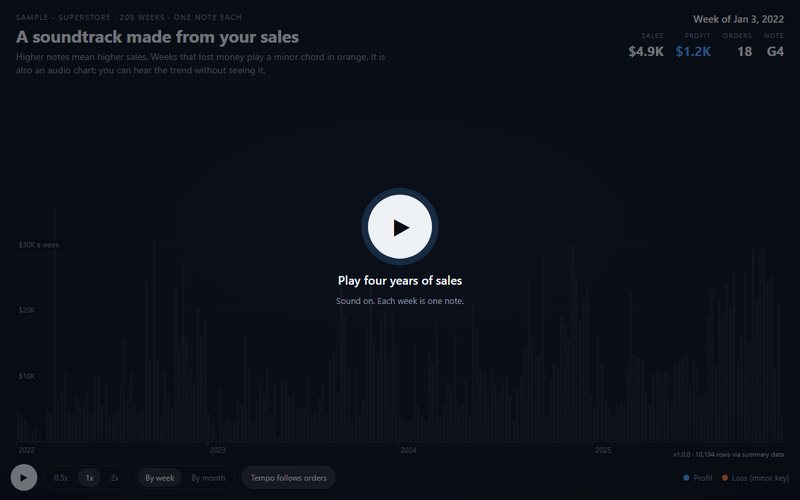 Four years of Sample Superstore sales played as music, one note per week.
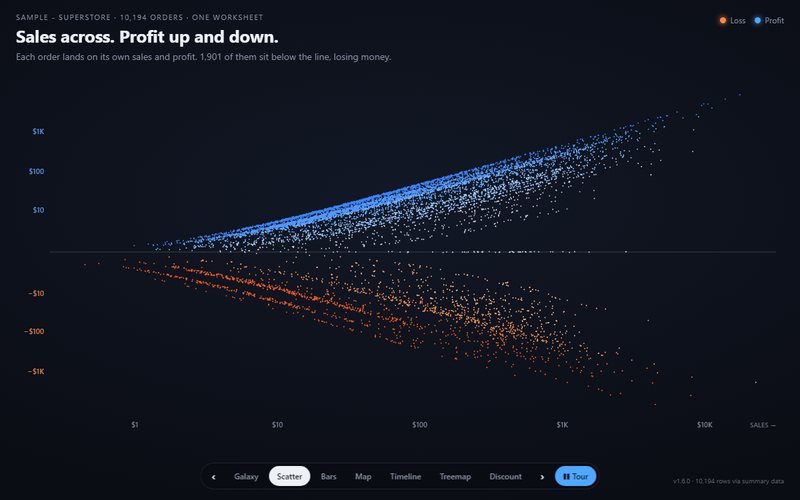 10,194 Sample Superstore orders as particles, morphing between charts.
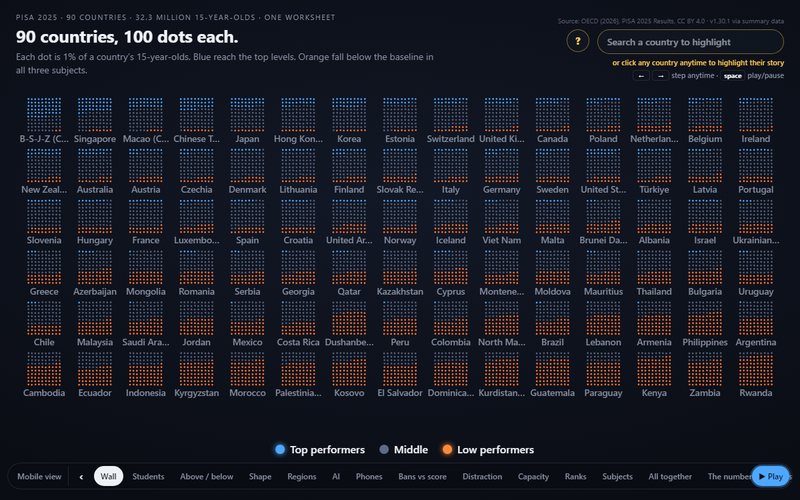 PISA 2025 as particles: 91 countries, 100 dots each. Data: OECD, CC BY 4.0.
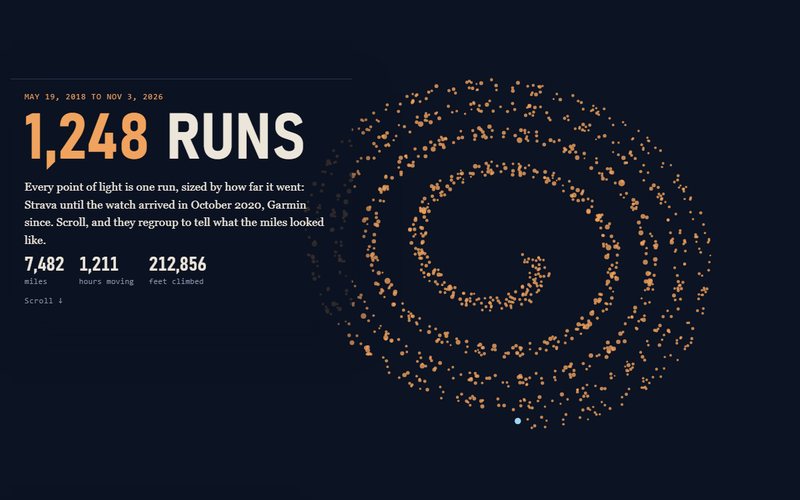 Every run since May 2018 (Strava, then Garmin) as particles, one dot per run.